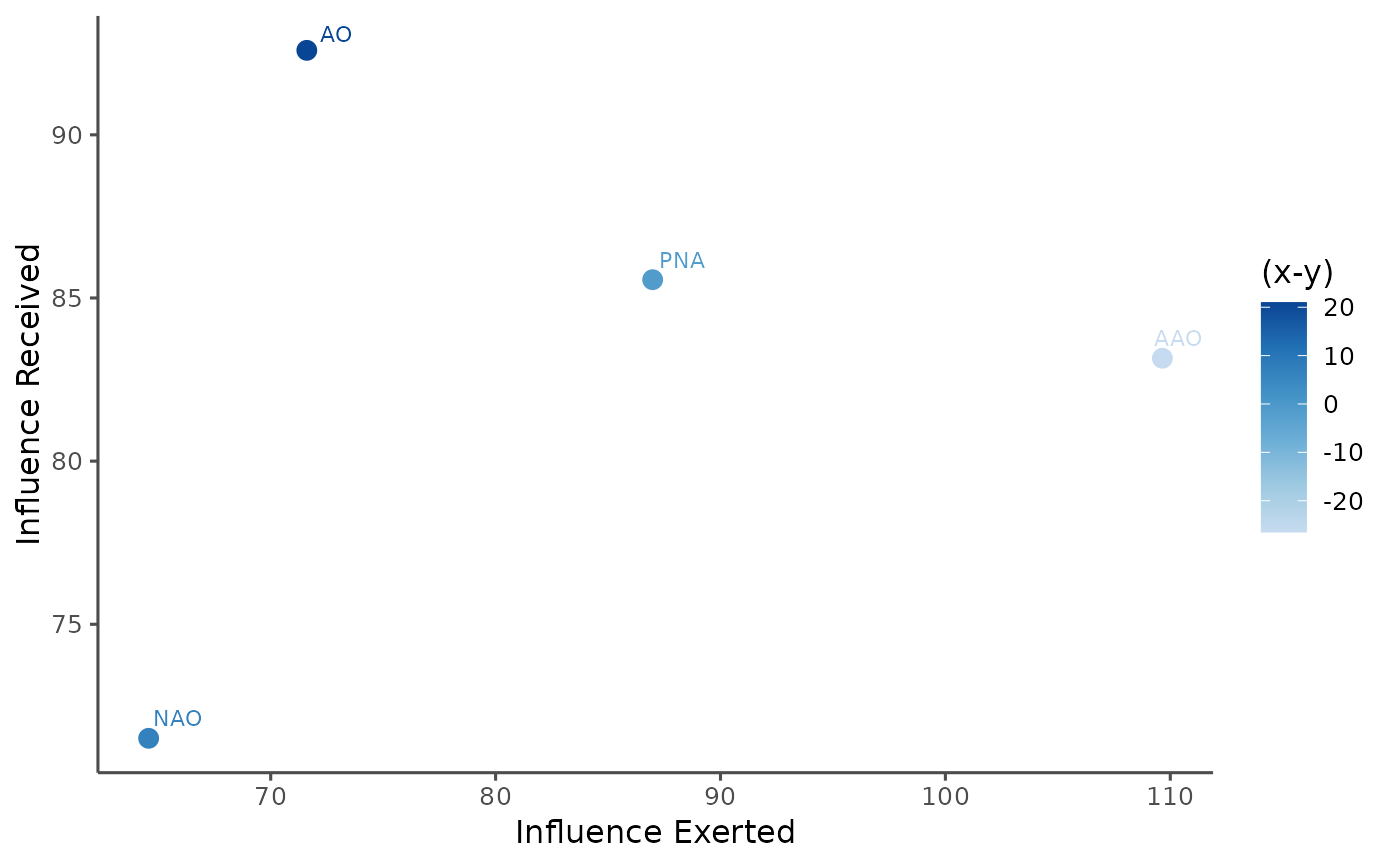
Generates a plot to visualize the effects of positive, negative, or dark causality. Displays the influence exerted versus influence received for each item. This function generates a scatter plot showing the influence exerted versus influence received for each item, colored by the difference between exerted and received influence.
Usage
# S3 method for class 'pc_effect'
plot(
  x,
  status = "positive",
  add_label = TRUE,
  point_size = 3,
  label_size = 3,
  ...
)
Arguments
- x
A
pc_effectobject.- status
Status of the effect to plot ("positive", "negative", or "dark").
- add_label
Logical, whether to add labels to the plot.
- point_size
Numeric value for point size (default: 3).
- label_size
Numeric value for label text size (default: 3).
- ...
Additional arguments passed to plotting functions.