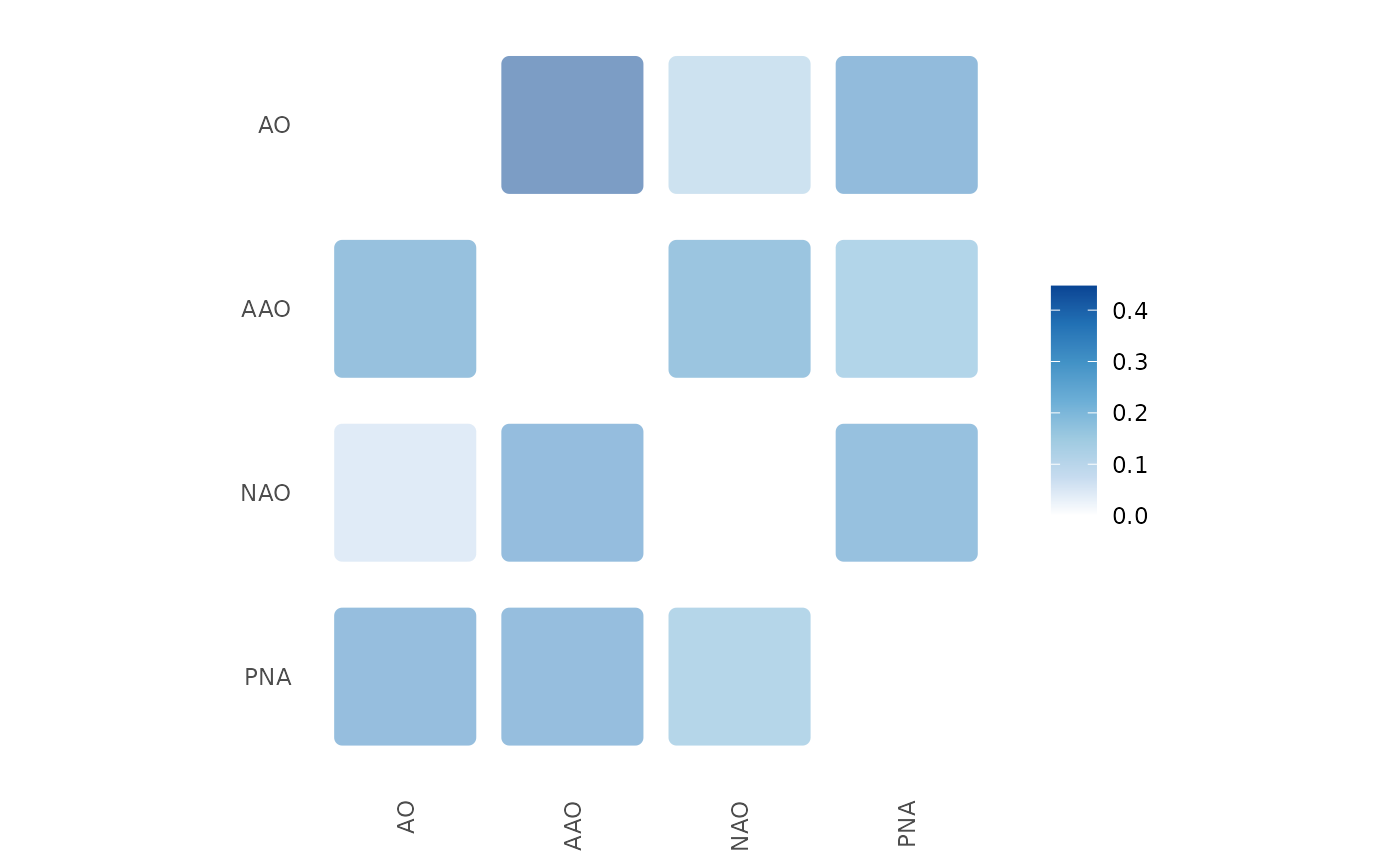
Creates a heatmap visualization of the pattern causality matrix for positive,
negative, or dark causality relationships.
This function generates a heatmap using ggplot2 to visualize the specified
causality matrix.
Arguments
- x
A
pc_matrixobject containing causality matrices.- status
The type of causality to plot ("positive", "negative", or "dark").
- width
Numeric value specifying the width of the bars (default: 0.85).
- height
Numeric value specifying the height of the bars (default: 0.75).
- radius
Grid unit specifying the corner radius of the bars.
- alpha
Numeric value specifying the transparency (default: 0.53).
- show_text
Logical, whether to show numerical values on the plot.
- show_legend_title
Logical, whether to display the legend title.
- ...
Additional arguments passed to plotting functions.
References
Stavroglou et al. (2020) doi:10.1073/pnas.1918269117

