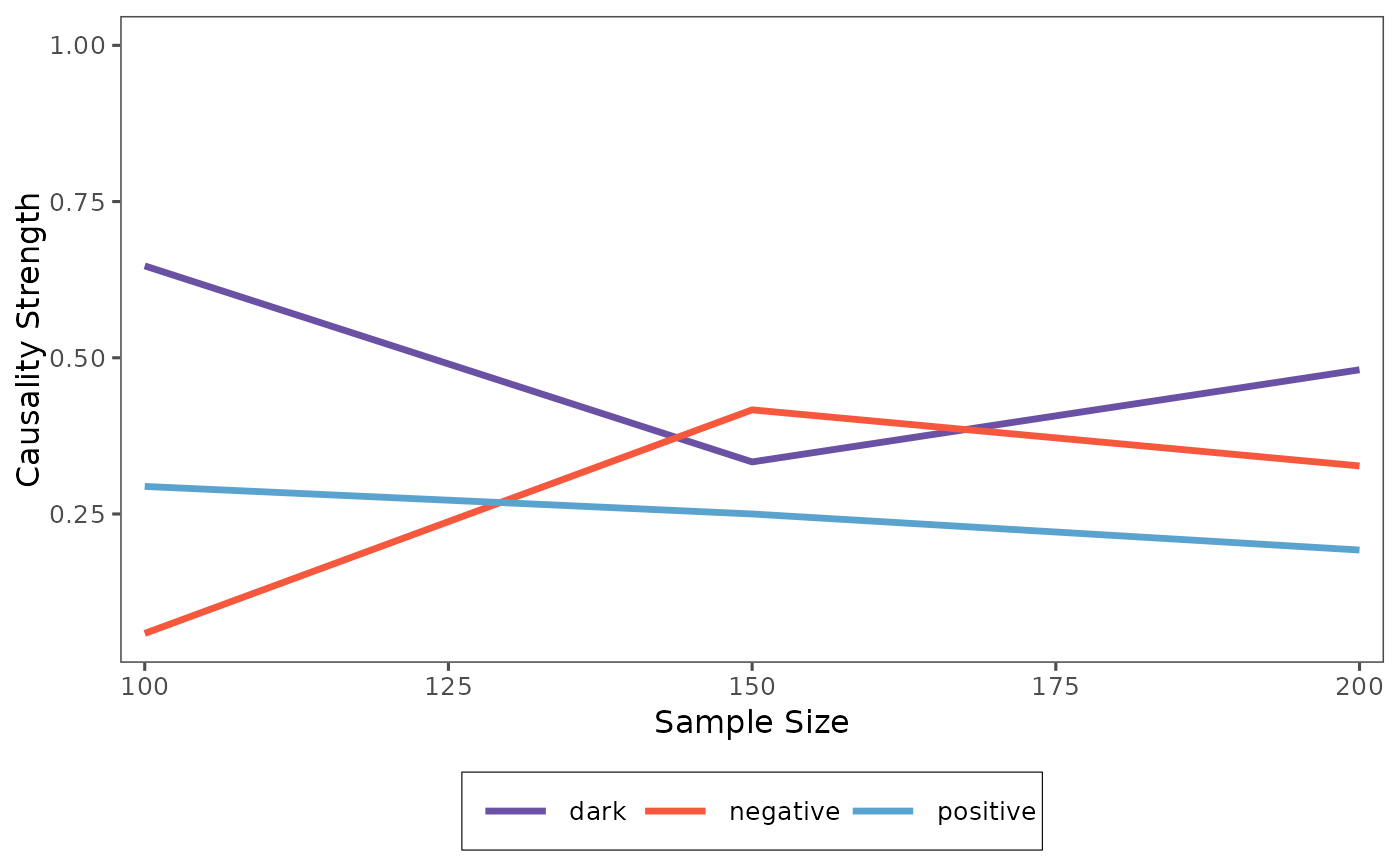
Visualizes the pattern causality cross-validation results. This function generates a line plot showing the causality strengths for different sample sizes.
Usage
# S3 method for class 'pc_cv'
plot(x, fr = FALSE, separate = FALSE, ...)Examples
data(climate_indices)
X <- climate_indices$AO
Y <- climate_indices$AAO
numbersets <- c(100, 150, 200)
cv_results <- pcCrossValidation(X, Y, 3, 2, "euclidean", 1, FALSE, numberset = numbersets)
plot(cv_results)

