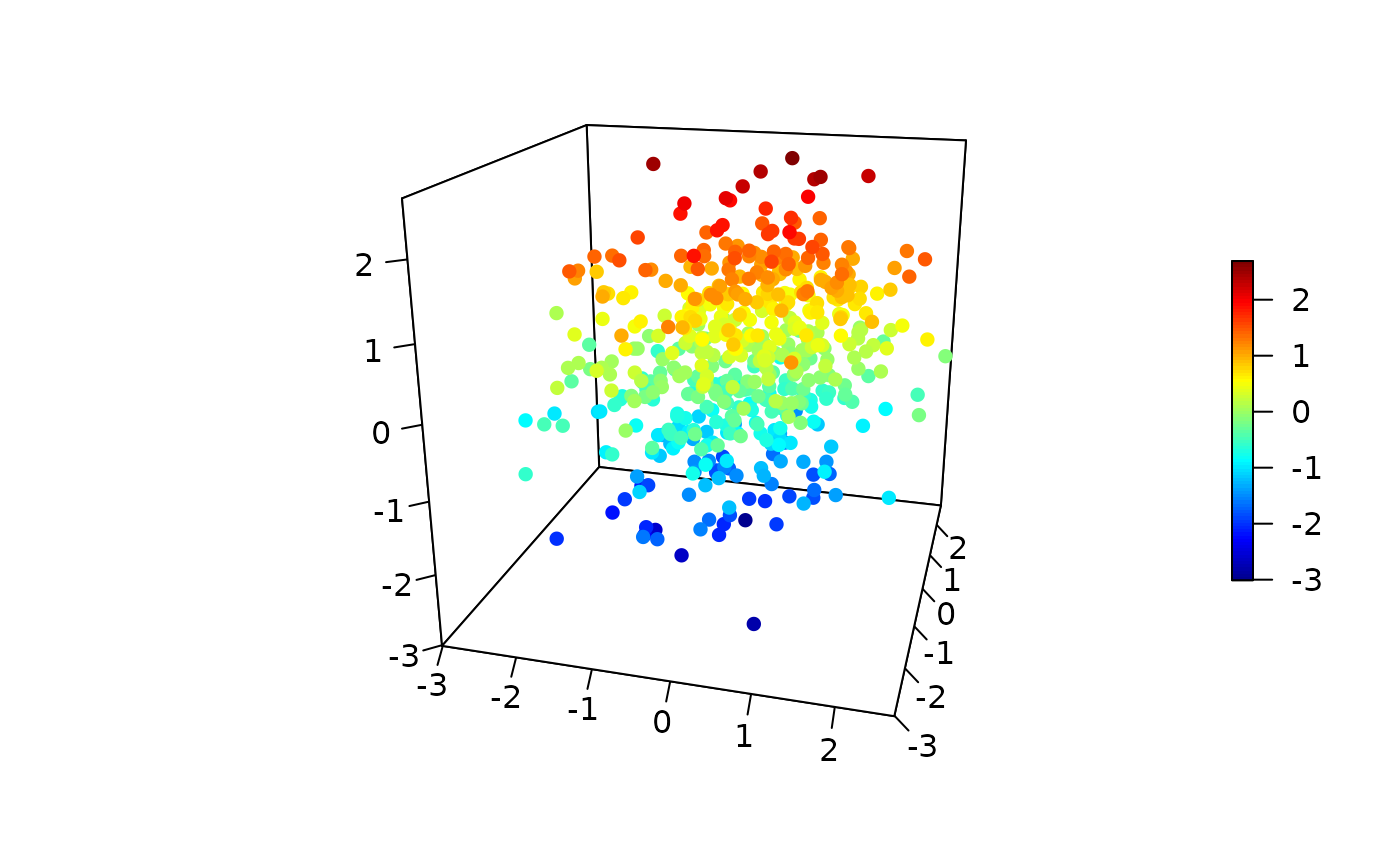
The plotState function generates a 3D plot of the reconstructed state space for time series data with an embedding dimension of 3. It uses the scatter3D_fancy function to create a detailed 3D scatter plot, which helps visualize the dynamics of the system in three dimensions.
Value
A 3D scatter plot that visualizes the state space of the time series data. The plot provides insights into the underlying structure and behavior of the dynamical system being studied.
Examples
# \donttest{
data(climate_indices)
state_data <- stateSpace(climate_indices$AAO, E = 3, tau = 2)
plotState(state_data,phi=20, style=1)

# }
# }
